Data Visualisation — Design System Component Library
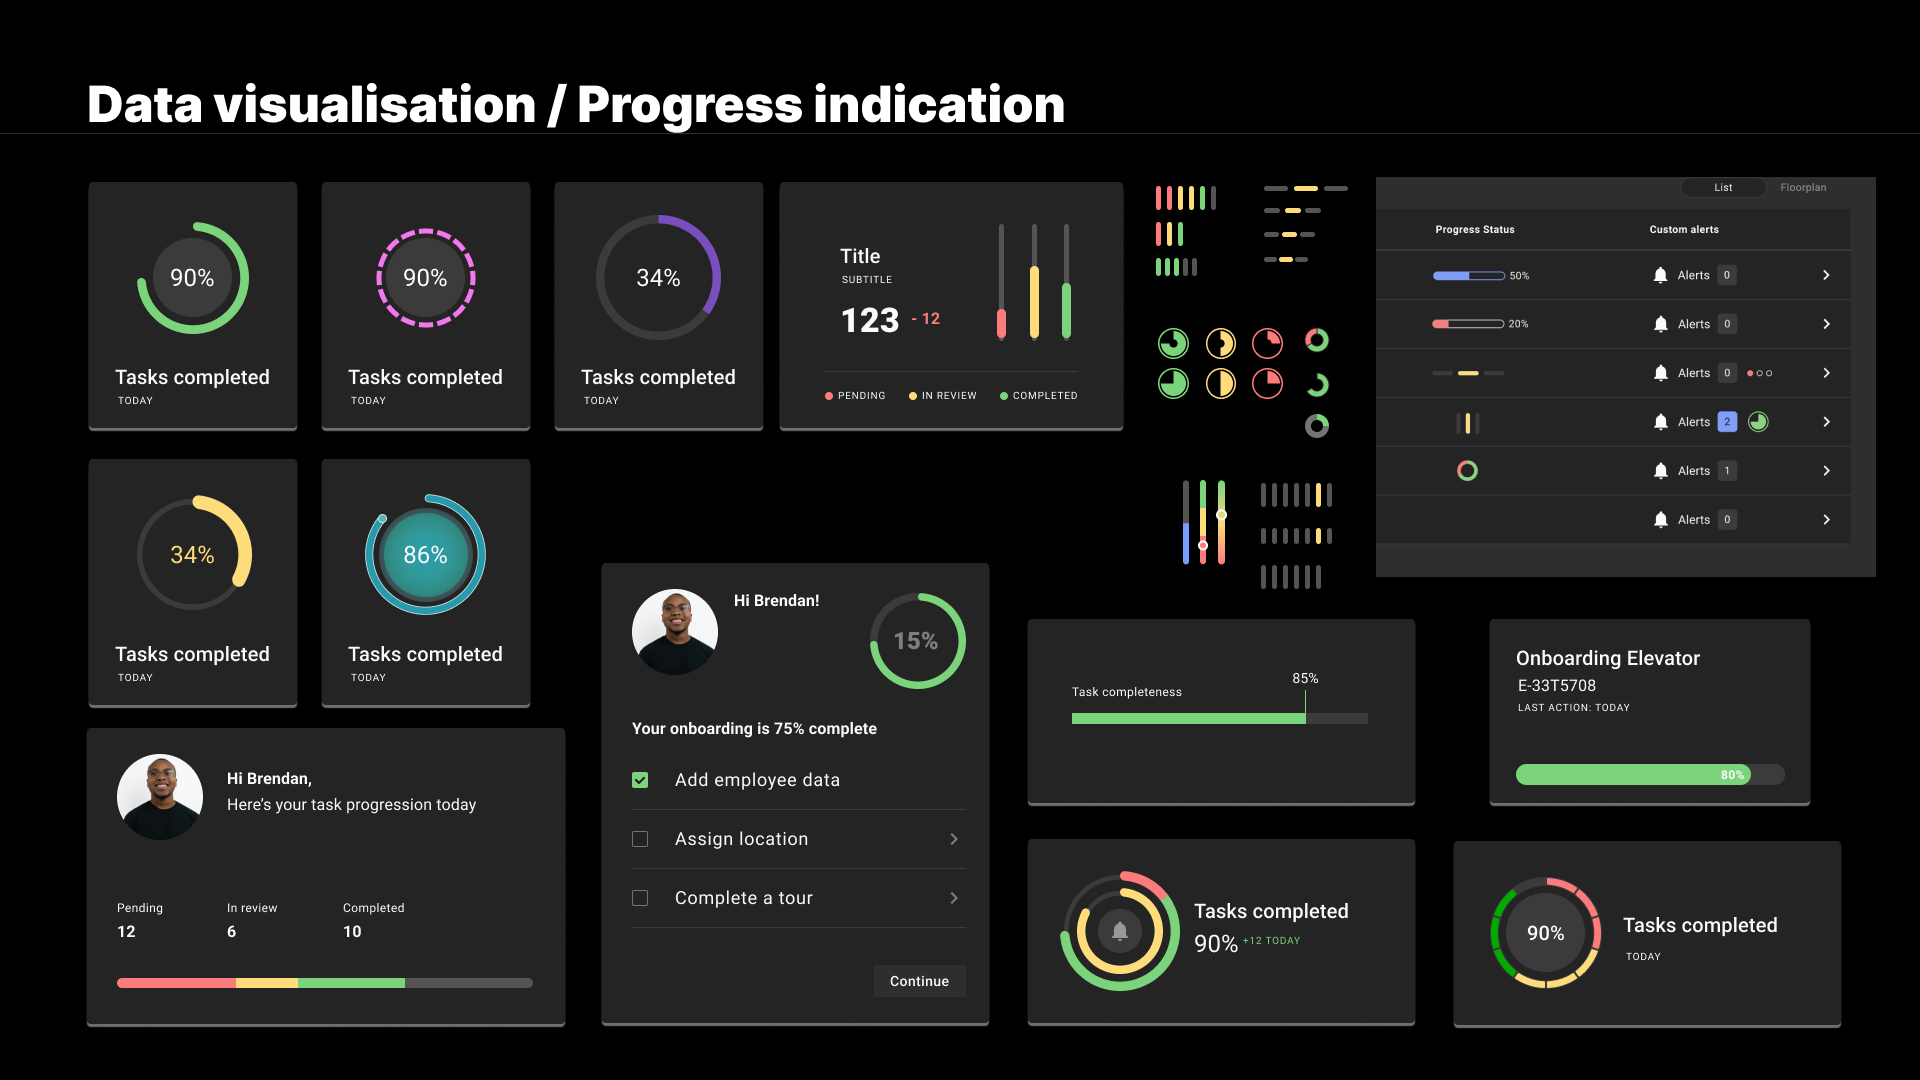
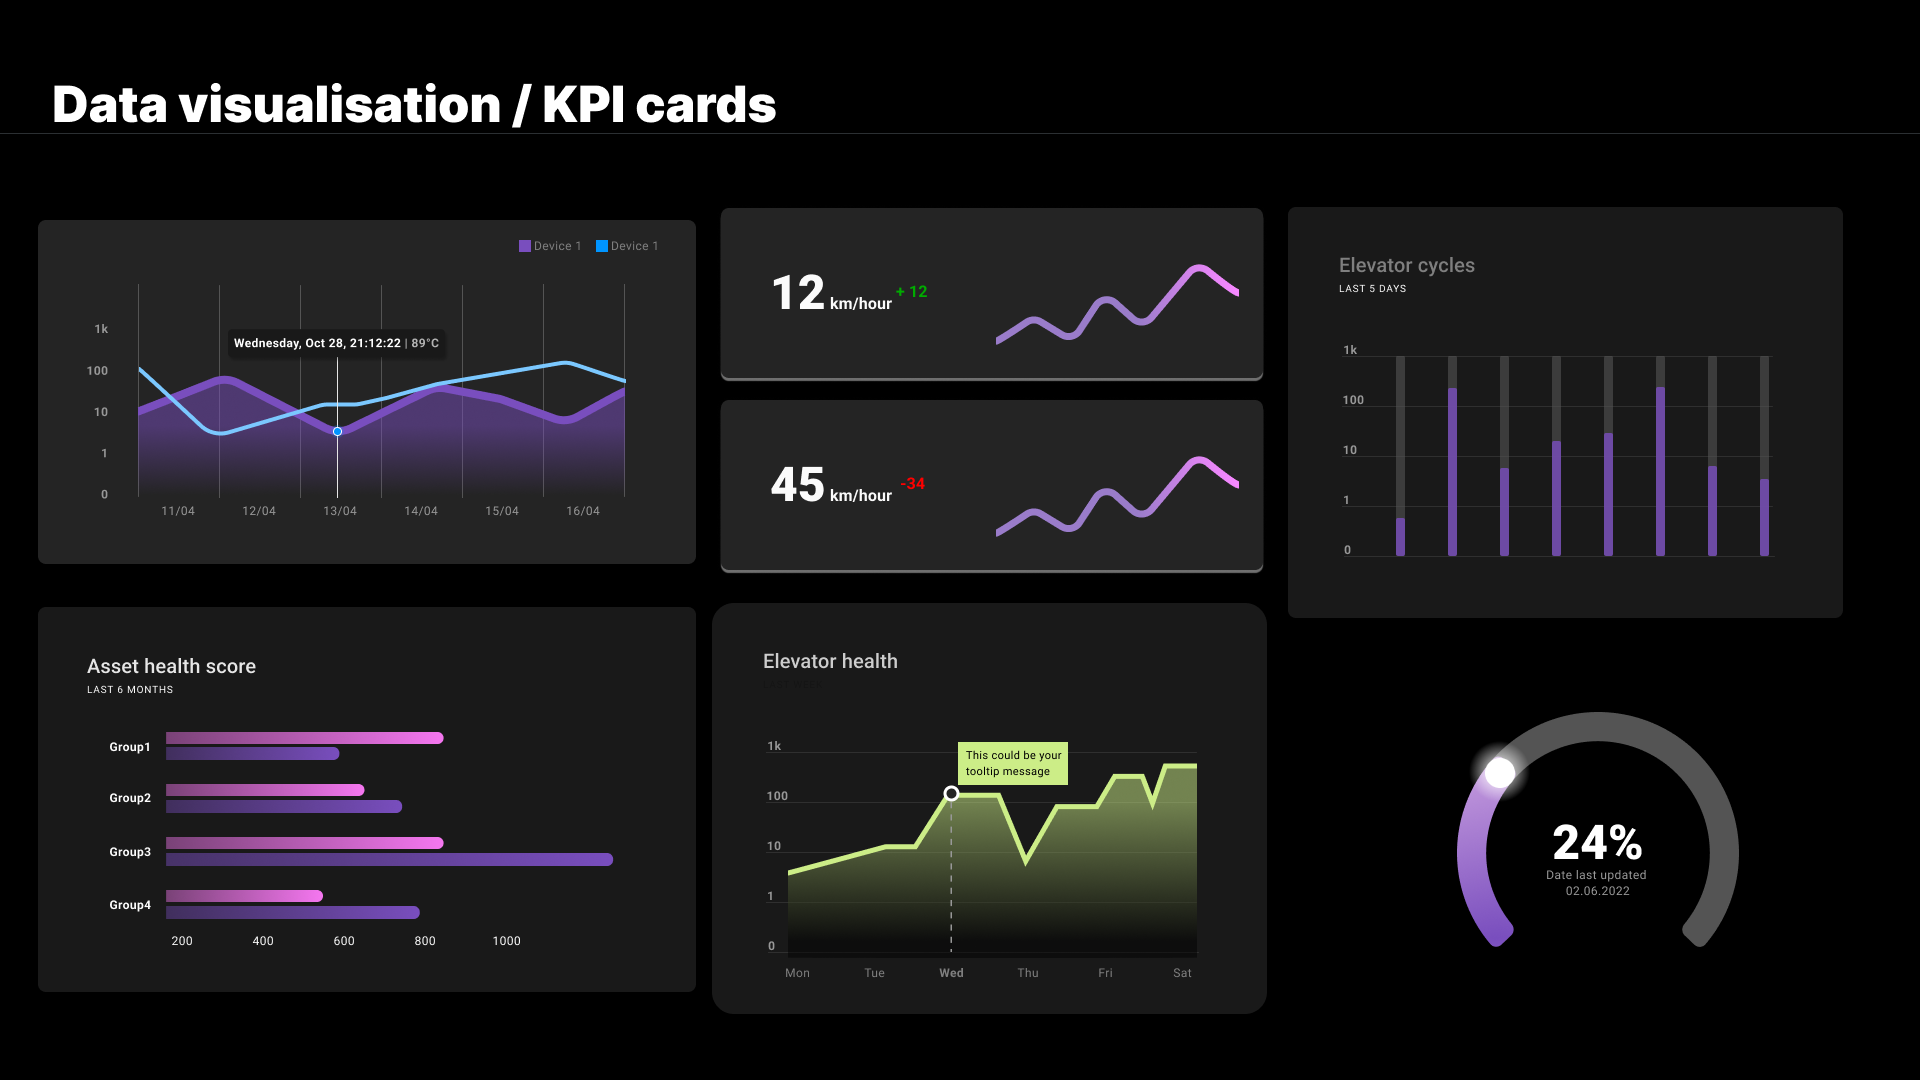
A deep dive into building a chart and data visualisation library as part of a broader design system for an industrial IoT platform. The work focused on exploring visual approaches to progress indication and KPI data — translating complex operational metrics into clear, scannable dashboard components.
Delivered in Figma, the library covered a range of UI patterns including progress rings, KPI cards, multi-series charts, and status indicators, all designed for consistency and scalability within the product framework.
Completed during tenure at relayr, a B2B IoT technology company.